Learn Excel Now

Conquer the Fear of Excel

  • Home
  • Training
    • Excel
    • MS Office
    • Outlook
    • PowerPoint
    • Word
    • OneDrive
    • Google
  • All-Access
  • eLearning
    • Excel Foundations
    • Micro Courses
      • Simply Excel
  • Resources
  • Login

Excel UNIQUE Function: Explained in 4 Minutes

September 29, 2022 by Tyrone Pernsley

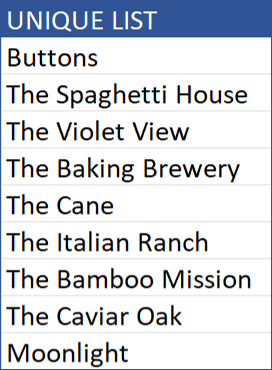
The Excel UNIQUE function returns a list of unique values in a list or range.

Note: This function is currently available only to Microsoft 365 subscribers.

To follow along, and for future reference or practice, the file Mike is working from can be found here. 

The formula in this video: =UNIQUE(B2:B19)

The tutorial in this video is included in the following interactive workshop: Excel Formulas & Functions 101

Thanks for watching!  We’re here to take the fear out of Excel, by empowering you with the essential tools and knowledge necessary for mastering it!

Become a member today: Learn Excel Now All-Access: One-Year Membership

Connect with us on social:
LinkedIn Facebook Twitter

Excel Rank Function: What is It & How to Use It

November 30, 2016 by Tyrone Pernsley

One of Excel’s advanced functions is the RANK function. This formula is used to rank numbers in a dataset by either ascending or descending order.

rank-function-featured-image

Let’s say you were running a customer loyalty program based on earning points. You need to rank customers’ point totals to determine what rewards they receive. You could do a simple sort, but your boss wants the customer names to stay in the same order.

This is the example we will use:

rank-functino-image-1

You will use the RANK function for this challenge, but let’s first explore how the function works.

Syntax of the Rank Function

=RANK(Number, Ref,[Order])

When you use the rank function, your first argument is the number. This is where you specify the cell containing the number you want to be ranked. Next, you identify the range of numbers to be used as the reference (Ref). Finally, you select the order, which is ascending or descending.

Solving the Challenge

So, we will identify B2 as the cell to be used. Then, identify the range as B2 through B11:

rank-function-image-2

Then, select Ascending order and we get our first result:

rank-function-image-3

Before moving onto the remaining lines in the table, we need to add absolute referencing to the range so that it stays consistent while the number being compared changes for each line. A reminder to use the $ between the letter and number of the cell for absolute referencing:

rank-function-image-4

Once you’ve added the absolute reference, you can now copy and paste the formula all the way down to reveal the rank for all lines:

rank-function-image-5

We at Learn Excel Now hope you feel comfortable using the RANK function after this article.

Like Learn Excel Now? Follow us on social media and share our content with your networks! And don’t forget to sign up for the Newsletter

Kevin – Learn Excel Now

How to Use the Excel MEDIAN Function

November 9, 2016 by Tyrone Pernsley

In this week’s Excel tip, we cover how to use the Excel MEDIAN function. The MEDIAN function is used the return the median value within the defined range.

For this demonstration, we will use the follow example:

median-image-1

The task assigned for this spreadsheet was to find the median sale amount. To do this, we will use the MEDIAN formula:

=MEDIAN(Number1, [number2]..)

Since the goal is to find the median in a single range, the formula becomes:

=MEDIAN(D2:D21)

median-image-2

And once you enter the formula, you get the return value:

median-image-3

Since there were 20 cells within the range, the formula found the average between two middle values.

We at Learn Excel Now hope you feel comfortable using the MEDIAN function now.

Like Learn Excel Now? Follow us on social media and share our content with your networks! And don’t forget to sign up for the Newsletter

Kevin – Learn Excel Now

Excel MAX and MIN Functions: Essential Tips for Success

September 21, 2016 by Tyrone Pernsley

There are far too many Excel functions for one person to learn, but there are essential functions every user should know. The MAX and MIN functions are two such functions. The MAX function allows you to find the highest number in given range. The MIN function does the opposite, providing you with the lowest number in a defined range. This quick tutorial will cover the basics on how to apply both functions.

For this brief tutorial, we will use the following dataset:

max-and-min-function-image-1

Let’s say you had this sales table and your manager wanted you to find the highest sale and lowest sale over a given time period. Using the example above, it might actually be easy to eye it up because there are only 20 rows of data. But in a real sales spreadsheet, it could range hundreds or thousands of rows.

So, we will use the MAX function. The syntax is easy:

=MAX(Number 1, number 2)

In above table, we are looking for the highest sale in column D, which means the function will look like:

=MAX(D2:D21)
max-function-1

Once the formula is entered, it will return the desired value:

max-function-2

On the flip side, the MIN function has a similar syntax:

=MIN(number 1, number2)

And again, our table is in column D, so the function becomes:

=MIN(D2:D21)
min-function-1

Once the formula is entered, Excel will return the desired value:

min-function-2

In addition to SUM, IF statements and VLOOKUP, the MAX and MIN functions are the most essential functions in Excel. We at Learn Excel Now hope you now feel confident in applying these functions to your everyday Excel use.

Like Learn Excel Now? Follow us on social media and share our content with your networks! And don’t forget to sign up for the Newsletter

Kevin – Learn Excel Now

Excel Functions: What is the MID Function & How to Use It

September 14, 2016 by Tyrone Pernsley

mid-function-featured-imageExcel offers a variety of different formulas and functions for everyday use. This week, we will focus on the MID function. This function allows you to isolate a sub-string of data within a larger string in a new cell. The syntax is simple and straightforward, making it an ideal function for quick tasks.

There are many reasons and ways you will use the MID function. Today’s example comes directly from a Learn Excel Now fan who emailed us with an issue he was having.

Brian wrote:

“The most boring and time-consuming task I have at work is to pull the processing numbers out of the sales database to send to our warehouse team. The sales report exports into Excel and all of the order info is jammed together on one line. I have to go line by line and rewrite the individual processing number. Depending on our daily orders, it can take me several hours to finish. And with so many lines to go through, it’s really easy to miss a number or get the line wrong. My boss has talked to me about it. Can you help?”

Yes, Brian, we are here to help. Let’s explore how the MID function can be used to help your task.

The syntax for the MID function is:

=MID(Text,Start_number,Number of Characters)

Simply put, this is saying: pull the data out of this range (text), starting on character (Start_Number) going this many characters after it (Number of Characters).

This spreadsheet will be used to approximate Brian’s report:

mid-function-image-1

As you can see, the Processing Number starts on character 13 and is 5 characters long. Thus, the way we would write this formula is:

=MID(A3,13,5)

mid-function-image-2

Now the processing number is nice and clear on its own line:

mid-function-image-3

IMPORTANT: In this example, each line has same the number of characters. So, you can copy and paste all the way down, however, for lines with different numbers of characters, you will need to count to the starting and end points individually.

mid-function-image-4

For Brian, using the MID function will save a ton of time and ensure accuracy.

We at Learn Excel Now hope you found this week’s tip on the MID function useful. There are many times this will come in handy, you just have to recognize the opportunity!

Like Learn Excel Now? Follow us on social media and share our content with your networks! And don’t forget to sign up for the Newsletter.

Kevin – Learn Excel Now

Excel IF Statements Part 3 – Nested IF Statements

August 10, 2016 by Tyrone Pernsley

Nested IF Statments Featured Image

In this week’s IF statement series, we are covering Nested IF Statements. This convenient formula allows you to return values based on multiple logic tests built into – or nested – in the formula itself. We will explore several uses of nested IF statements in demonstrations below.

Syntax of Nested IF Statements

When you write a nested IF statement, you are essentially saying “If true, do this, if true, do this, if true, do this…if false, then do you this.” You can nest up to seven IF criteria within the formula.

The syntax for nested IF Statements is:

=IF(True-This,IF(True, this,IF(True,this,IF(True,This,IF(False,this))))

Notice: For each new IF statement, you open a new parenthesis, however, the parenthesis closing all come at the end of the formula.

Uses for Nested IF Statements

There are many reasons to use nested IF statements and you will have to determine the best situations to employ them. For the purposes of demonstration, we will use nested IF statements to calculate commission rates based on a sliding scale and salary increases based on years of service.

Calculating Commission on a Sliding Scale

If you remember our Simple IF Statements from last week, we used a single IF condition to return a flat bonus rate or determine No Bonus. But, what if there is a sliding scale? By nesting several IF statements together, you can create a dynamic formula that returns the commission amount based on a sliding scale.

Let’s say you had the following spreadsheet:

Nested IF Statements Image 1

You can see the sliding scale in the table to the right. To write this scale into a nested IF statement you would write it as:

=IF(D2<101,”No Bonus”,IF(D2<201,D2*0.03,IF(D2<301,D2*0.03,IF(D2<=500,D2*0.04,IF(D2>501,D2*0.05)))))

Here, what you are saying is: IF the amount in column D is less than 101, return the value No Bonus, IF it’s less than 201, times the amount by 2% (0.02), IF less than 301, times it by 3%, IF less than or equal to 500, times it by 4%, and if it’s greater than 501, times it by 5%.

Here is how that looks in Excel:

Nested IF Statement GIF 1 - Commission

As you can see, it automatically calculates the commission payout based on the range of the sale amount.

Calculating Salary Increase Based on Years Employed

Here we have a similar issue. We can see the employee list, their current salary and years employed. We have a table that shows what percentage their salary should increase based on length of employment.

Nested IF Statments Image 2

To quickly find the new salary amount, you would write the following IF statement:

=IF(C2<6,B2*1.02,IF(C2<11,B2*1.03,IF(C2<16,B2*1.04,IF(C2<21,B2*1.05))))

Here, we are saying “IF the years in column C are less than 6, then increase the salary in column B by 2% (1.02). IF it’s less than 11 years, increase by 3%, IF less than 16 years, increase by 4% and IF greater than 21 years, increase by 5%. “

Here is how it looks in Excel:

Nested IF Statement GIf 2 Salary Increase

As you can see, there are a variety of ways and reasons to use nested IF statements. We here at Learn Excel Now hope you know feel comfortable applying these functions in your spreadsheets.

Like Learn Excel Now? Follow us on social media and share our content with your networks! And don’t forget to sign up for the Newsletter

Kevin – Learn Excel Now

Excel IF Statements Part 2 – Intro to Simple IF Function

August 3, 2016 by Tyrone Pernsley

In Part 2 (get Part 1 Here) of our IF Statement series, we are discussing simple IF statements. These are the basic formulas for returning a values based on your (the user’s) criteria. These functions can be used for a variety of purposes and the examples below explore some of the potential uses of IF statements.

A Definition of IF Statements

IF Statements are logical functions in Excel. When you define the criteria for the statement, you are essentially saying, IF the defined condition is true, then return this value, otherwise (if false) return this value.

The syntax of IF Statements is:

=IF(logical_test, [value_if_true],[value_if_false])

Uses of IF Statements

As you use Excel, you might come across various instances where IF statements will be useful. Below are two examples based on real-world issues where these functions come in handy.

Example 1: Making Purchase Decision Based on Margins

Let’s say you received the following spreadsheet:

IF Statement Example 1

Your boss is trying to determine if the company should purchase wholesale products from the new vendor. You have your wholesale price the company will pay and the expected retail price the company can charge. Your boss wants you to find the net gain and profit margin. For any product where the profit margin is 30% or greater, you need mark it “Purchase.” For any product with a profit margin less than 30%, you need to mark it “No”

So, here is your step-by-step process:

  • Subtract the Wholesale amount from the Retail amount under the Net column
  • Divide the Whole amount by the Net amount in the Margin column – change number to a percentage
  • Highlight both cells and use the fill handle to drag the Net amount and Margin percentage all the way down.

Now, at this point, you could manually enter Purchase or No by eyeing up the margin percentage to see if it’s greater or equal to 30%. But you can save time and ensure accuracy by using an IF Statement.

Here is how you would do that:

  • Under the Purchas column, enter your formula: =IF(E2>=30%, “Purchase”, “No”)

What this formula states is “If the value in column E is greater than (>) or equal to (=) 30%, then return the value Purchase. If not, return the value NO.

Once the formula is entered, you can again use the fill handle to drag it all the way down.

IF Statements GIF 1

Example 2: Determining Commission Bonus Payout

You received the following spreadsheet:

IF Statements Example 2

Your job is find the commission rate of 5%. For any sale over $300, the salesperson receives the 5% sales commission bonus. Otherwise, they don’t get a bonus.

Step-by-step:

  • In the Percent of Sale column (E), enter the following formula:  =d2*0.5
  • This will yield the 5% sales amount
  • Copy the formula down using the fill handle
  • Under the Commission Payout column (F), enter your IF Statement:  =IF(D2>300, “E2”, “No Bonus”)

What this formula states is: If the sale amount in column D is greater than 300, then return the commission value in column E, else, state No Bonus

IF Statements GIF 2

As you can see, there are a variety of uses for IF statements. It really depends on what you need to use Excel for. Coming next week: Nested IF Statements!

Like Learn Excel Now? Follow us on social media and share our content with your networks! And don’t forget to sign up for the Newsletter

Kevin – Learn Excel Now

Excel IF Statements Part 1 – Intro to CountIF

July 27, 2016 by Tyrone Pernsley

CountIF Featured Image

IF Statements in Excel are some of the most useful functions you can use. There are a variety of IF functions and each one can be used for a variety of purposes. Over the next few weeks, we will explore the various IF functions, their uses and how to create them. This week, we are focusing on the CountIF Function.

IF statements are often variations on standard functions, but they allow you to return a value based on specified criteria. The normal Count formula (=count(range)) will return the total number of cells containing data within a range. Here’s a quick demo:

CountIF Gif1

As you can see, it just counted the total number of cells with data.

But let’s say you wanted to count the total sales to a particular company. In this case, you could use the CountIF function to find the total sales to a company.

The syntax for CountIF is:

=CountIF(range, criteria)

So, if we’re going to find the totals to Eastern Company, the formula becomes:

=countif(F2:F21, “Eastern Company”)

And that will the return the specified value:

CountIF Gif2

Note: if the value you’re using as the specified criteria also exists in the table, you can select any cell containing that value rather than writing it out:

CountIF Gif3

The above examples are if the value you’re looking for is an Exact Match. You can also do greater or less than.

Let’s say you wanted to find the total number of sales greater than $300. For that you would use this formula:

=COUNTIF(D2:D21, “>300”)

Countif Gif5

Now in some cases you might want to it count equal to And less than (or greater than). In those cases, you will add the = sign after you enter the greater than (>) or less than (<) symbol.

So, now that we know the number of cells containing values greater than 300, let’s find the number of cells that are equal to or less than 300. That formula looks like:

=countif(d2:d22, “<=300”)

As you can see, this than finds any cell with 300 or less:

CountIF Gif6

We here at Learn Excel Now hope you now feel comfortable using the CountIF Function. We will be brining you more IF statement tips over the next several weeks so stay tuned!

Like Learn Excel Now? Follow us on social media and share our content with your networks! And don’t forget to sign up for the Newsletter

Kevin – Learn Excel Now

Making Sense of VLookUp: Quick and Easy Tips

April 27, 2016 by Tyrone Pernsley

Making Sense of VLookUp 

At Learn Excel now, we are always getting questions about VLookUp. Making sense of VLookUp requires breaking the function down and understanding the key components and what you are trying to find.

What is VLookup?

The VLookup function allows you to find data that is stored in a table from another spreadsheet or a smaller table.

There are 2 ways to enter the VLookUp Function:

  1. Go to the Formulas Tab, click the “Lookup & Reference” dropdown and select Vlookup. This will open the following dialogue box:Making Sense of VLookUp Image 1
  2. You can enter the function as a formula:
    =VLOOKUP(lookup_value, table_array, col_index_num, [range_lookup = TRUE])

Syntax of the VLookup Function:

Lookup_value: The value to search in the first column of the table. This can be a reference or a value.
Table_array: This is two or more columns of data. You can use a reference to a range or a range name. The values that appear in the first column are those searched by the lookup_value. These values can take many forms including text, numbers, or logical values.
Col_index_num: This is the table from which the matching value is returned. There are several different scenarios for the value’s placement:

  • If the col_index_num is less than 1, then the vlookup shows the error “#Value!”
  • If the col_index_num is greater than the number of columns in the table_array, then the vlookup shows the error “#REF!”
  • If the col_index_num is 1, then the value will be in the first column of the table_array.
  • If the col_index_num is 2, then the value will be in the second column of the table_array (and so on)

Range_lookup: This function is meant to specify whether vlookup should find an exact or approximate match of the value you search.

  • If “true” or 1 is used, then an exact is returned unless there is not an exact match, in which case the next largest value that is less than the lookup_value is returned.
  • If “false” or 0 is used, then an exact match is returned. If there are two or more values that are an exact match, the first value found is used. If no exact match is found then the error “#N/A” is returned

S0, what does that all mean?

Let’s say you wanted to find the total profits from sales to XYZ Company in the following table:

Making Sense of VLookUp Image 0

Now, in this simple table, you could just sum the individual cells under the Profit heading that correspond to XZY Company. But, if this table were hundreds of rows long, that would be impractical.

So, we are going to use VLookUp:

=VLOOKUP(“XYZ Company”,A1:E19,5,)

Making Sense of VLookUp Image 2

In this formula:

XYZ Company Acts as the Lookup_value
A1:E19 is the table_array
5 is the col_index_num
Because we are just looking to return a value, there is no Range_lookup required.

Other Helpful Tips:

  • You need to use “Ctrl,” “Shift,” and “Enter” to create brackets around an array formula rather than simply using “Enter.”
  • Keep in mind that table_array doesn’t differentiate between uppercase and lowercase letters.
  • Put the value of the first column of the table_array in ascending sort order to ensure that vlookup gives you the correct value. To set this, click on the “Data” icon on the tool bar, then select “Sort,” and finally select “Ascending.”
  • If you get the error message “#N/A”, check to make sure that the lookup_value is not smaller than the smallest value in the first column of the table_array.

We here at Learn Excel Now hope you now feel more comfortable using VLookUp. It is one of the most widely used Excel functions but it is a complicated tool. Making sense of VlookUp requires practice and use.

Like Learn Excel Now? Follow our social media pages and share our Excel content with your networks!

Kevin – Learn Excel Now


Excel Time-Saving Formulas: Quick & Easy Tricks to Work More Efficiently

January 13, 2016 by Tyrone Pernsley

As any user knows, Excel offers a huge variety of formulas and functions for processing calculations. However, searching and finding each one can be time-consuming. The following Excel time-saving formulas will help you quickly process the information you need so you can focus on your work.

AutoSum

The autosum feature is a great shortcut for quickly adding up columns and rows of numbers in Excel. To use it, click on the last cell in the row or column that you want to find the sum of and click on the autosum (sigma) button. A blue dashed-line box will outline the data that Excel thinks you want to include. If you need to make adjustments, simply drag the blue dash-lined box to hold the data that you want. When you have verified that this is the correct data, push enter.  The sum of your column of your row or column will appear in that cell.

Goal Seek

Goal Seek is great for finding an input, by working backwards and defining an output in order to figure out what input you would need to enter. It saves you time from having to use a trial and error method. To use this feature, first enter your data in a spreadsheet. Next, you will need to click on the cell that you want to change. Go to the “Data” tab and click on the “What-If Analysis” and select “Goal Seek” from the drop-down menu. The goal seek dialog box will pop up and you can enter your values. The “Set cell” box will contain the cell that you clicked on originally (where the answer will go). In the “To value” box, enter the result that you want the data to align with. In the “By changing cell,” highlight the cells that you want to change in order to produce the result that you want. Click “Ok” and the goal seek status dialog box will appear. It will give you the solution that it found, but listing your “target value” and current value that it calculated. If you are satisfied with the result and want it to replace the original data, click “Ok.”

Excel Time Saving Formulas image 1.jpg

Excel Time Saving Formulas image 2.jpg

Concatenate

The concatenate feature allows you to join together two or more cells into one. For instance if you have data where one column has first names and another column has last names, you can use this feature to join them together in one column. Click on the cell that you want to enter the new value in and then enter your formula =CONCATENATE( ). Between the parentheses, you need to enter the cells that you want to join together.

Examples of formulas:

Excel Time Saving Formulas image 3.jpg

We here at Learn Excel Now hope you now feel confident in your ability to use Excel time-saving formulas. It is our desire to bring you the best advice possible to effectively and efficiently use your desktop features so you can focus on your work. Subscribe to our blog to receive weekly Excel tips. If you’re looking for more in-depth training check out our upcoming instructor-led, live online trainings.

Liked these Excel formula tips? Have questions? Leave your comments below; we’d love to hear from you.

Getting Social with Excel: Spread the word and share the knowledge!

Kevin – Learn Excel Now

  • 1
  • 2
  • Next Page »
All Access Subscription
Our 1-year all-access subscription provides step-by-step guidance for mastering Microsoft Office applications, with workshops, exercises and quick reference eGuides. It's perfect for anyone that needs to brush up on certain skills or even folks who need to learn the programs - from a beginner’s level.
Excel Foundations
Take the fear out of Excel with this 20 module self-paced training course. You will cover the most essential topics to develop a solid foundation of Excel or a lifetime of mastery.

Learn Excel Now helps you conquer the fear of Excel. By providing self-paced and instructor-led training and free strategies and guides, we leave no Excel mystery unsolved.

  • Home
  • Training
  • All-Access
  • Excel Foundations
  • Resources

Connect with Us

  • Facebook
  • Linkedin

Contact

Learn Excel Now
questions@learnexcelnow.com
1-484-259-7664 or 1-800-964-6033
660 American Ave
Suite 203
King of Prussia, PA 19406

Microsoft® Office Excel® is a registered trademark of the Microsoft Corporation in the United States and other countries. All rights reserved.

Copyright © 2023 ­Learn Excel Now

Terms of Service

Privacy Policy

Copyright © 2023 · News Pro Theme on Genesis Framework · WordPress · Log in

WELCOME BACK!

Enter your username and password below to log in

Forget Your Username or Password?

Reset Password

Lost your password? Please enter your username or email address. You will receive a link to create a new password via email.

Log In