
Creating Excel Tables: Quick Tip to Get Up-to-Speed
Excel provides you with many preset formatting options that you simply need to click to activate. One of the most common and most useful is to set your data as a table. There are many advantages to organizing your data in a table. It makes it easier to sort and filter important data, find totals automatically and create charts and graphs.
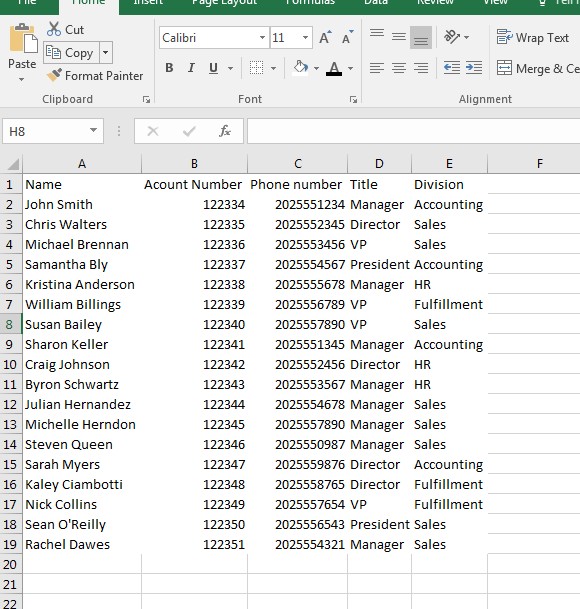
Setting your data as a table is fairly easy. First, you take your basic dataset:
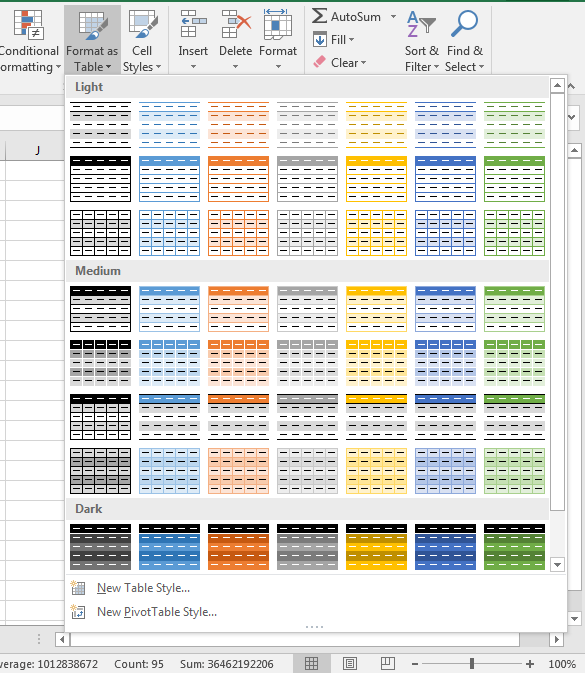
And then you apply the table setting:
As you can see from the above Gif, there are many table styles to choose from:
This gives you the power to customize your Excel table to your preference.
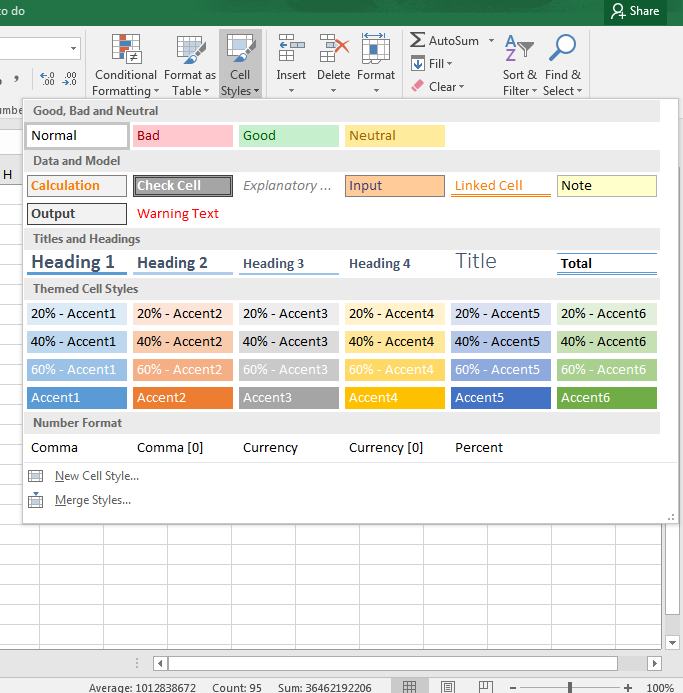
Pro tip: you can add more customization to your formatting by using the Cell Styles tool to add colors, text formatting and other elements to make your table pop:
Once you have your table formatted, you can us the dropdown menu to quickly filter information:
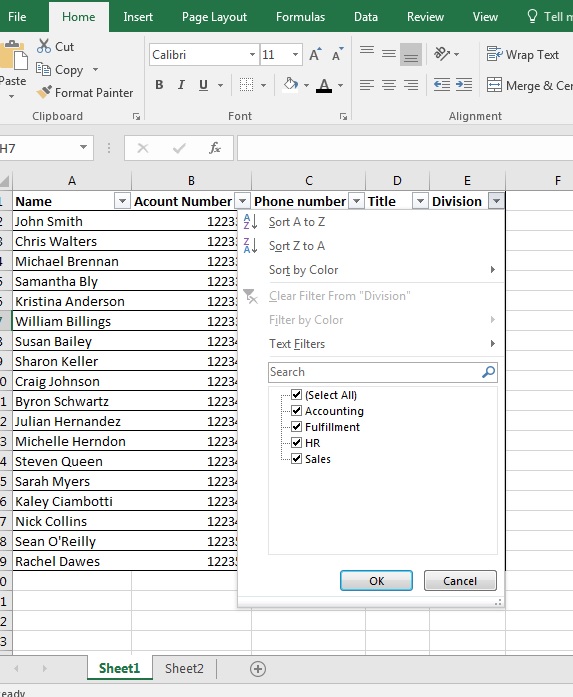
You also have the ability organize your dataset in a variety of ways.
We here at Learn Excel Now hope you enjoyed this week’s quick tip on Excel Tables.
If you want to take your Excel skills to the next level and tackle the foundations of excel , check out our self-paced course.
Like Learn Excel Now? Follow our social media pages and share out content with your networks!
Kevin – Learn Excel Now
Responses