
Sorting Data with Excel Pivot Tables
The Pivot Table is one of the most useful features in Excel. Sorting data with Excel Pivot Tables allows you to examine your data from multiple points of view for better summary and analysis. You can sort data, count totals, averages, percentages, etc. In addition to giving you the ability to organize your data, Pivot Tables also makes your data more presentable.
Creating a PivotTable
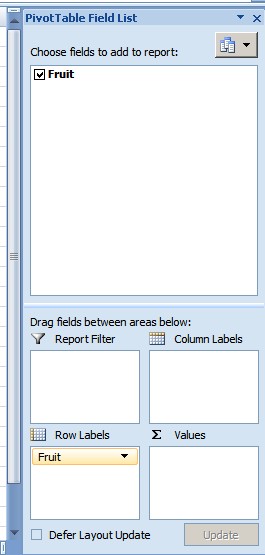
Once you have highlighted the data that you want in your Pivot Table report, go to the “Insert” tab and click on “Pivot Table.” You can then be able to choose to create the Pivot Table report on a new page or keep it on the same page as your data. The Pivot Table that is generated will be blank, so you have to pick which values you want and where you want them. You can arrange your data in rows or columns and include sums of different data series. To do this, you simply use the Pivot Table Field List on the right to drag and drop fields to the area where you want them to go. Your Pivot Table will then be generated and then you can sort and organize it.
Sorting Data
PivotTables can be used to organize and sort all kinds of data. Some examples include:
- Alphabetically
- Numerically
- By dates and time
The options for selecting which data to look will be affected by the row and column labels in the original data set. For example, if you have a list of purchases and want to organize them by date, you can move the two column labels into the Pivot Table fields.
In the Pivot Table report, click on the drop-down arrow next to “Row Labels” or “Column Labels,” then select how you want your data to be sorted. If all of your values are words, you’ll be able to sort the data alphabetically from A to Z or from Z to A. For numeric values, you can sort it from smallest to largest or from largest to smallest. For times and dates, you can sort form oldest to newest or newest to oldest. You can also drag and move data to sort it in any way you want.
Once you have your data organized into the proper fields, you can begin to summarize the findings for improved decision-making.
We here at Learn Excel Now hope you enjoyed this quick guide on sorting data with Pivot Tables. It is our desire to bring you the best advice and training available so you can effectively and efficiently use your Excel tools.
Liked this sorting data with Excel Pivot Tables quick tip? Have questions? Leave your comments below; we’d love to hear from you.
Getting Social with Excel: Spread the word and share the knowledge!
Kevin – Learn Excel Now