
Excel Tricks: Easy Data Fill
Excel is great for summarizing your data. You can create tables, charts, PivotTables, and more. The following tips are provided to give you the power to do easy data summary in Excel.
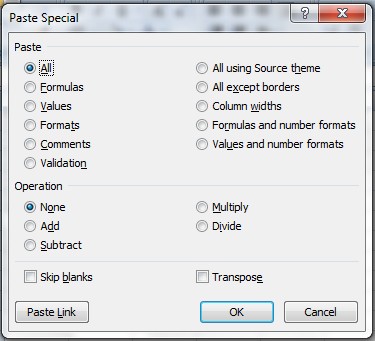
Special Paste
The Special Paste feature can be used to copy and paste both static and linked data. To use it, first copy the data that you want to paste by highlighting it and either right clicking and selecting copy or pressing “Ctrl” + “C.” Click on the first cell where you want your data to be pasted, right-click, and select “Paste Special.” From there, a dialog box will appear and you can choose how you want the data to be pasted. You can choose to paste everything, only the formulas, only the values, only formats and more. If you want to apply a mathematical operation to your data, you can select which operation you want to apply. You can also choose to not copy blank cells by checking the “Skip blanks” box. To have your columns be pasted as rows or to have your rows pasted as columns, check the “Transpose” box.

Auto Fill
Instead of entering in all of your data manually, you can use the Auto Fill feature to automatically fill the cells with the data that you want based on a pattern or based on the data that you’ve already entered. To copy a repeated value, click on the cell that you want to copy and in the bottom right corner, your cursor will turn into a little black plus sign, and then you can drag your value down or across. You can also copy a pattern like numbering 1-20, months, or number patterns (like even or odd numbers). To number your row or column from 1 to another value, type 1 and 2 into the first two cells, then highlight the two cells and when the black plus sign appears, drag the numbers to the value that you want. To copy a series of months, type two consecutive months in the first two cells, and then drag the column or row to show the values that you want. To create a pattern, type the first two or three numbers in that pattern’s series, highlight the cells, and when the black plus sign appears drag until you have your desired values.

Case Change
If you have a messy or inconsistent data table, you can clean it up by making the text more uniform by using the case change feature. Enter the formula that you want to use (Upper, Lower, or Proper) and select which cell you want to change.
Upper, Lower, & Proper Formulas:

We here at Learn Excel Now hope you now feel confident in your ability to do easy data summary in Excel Dashboards. It is our desire to bring you the best advice possible to effectively and efficiently use your desktop features so you can focus on your work. Liked these Excel Database tips? Have questions? Leave your comments below; we’d love to hear from you.
Getting Social with Excel: Spread the word and share the knowledge!
Kevin – Learn Excel Now